Contribute to Climate Prediction on Your Home Computer

Are you interested in climate change prediction? Though a Pew Center poll from last fall put concern for climate change at the bottom of the list of most American’s environmental priorities, many profess an interest in determining the direction of climate in this century (regardless of their opinions about the sources of climate trends).

The key issues with climate prediction are complicated at best but can boiled down to three important themes:

  • Can we find the range of change that can be expected under various scenarios?  How warm can we get and where will that warming be most felt?  Will it be 1 degree Celsius or 7?  This is largely a question of understanding the physics of our planet, sun and atmospheric “skin.”
  • Can we determine the sensitivity of the planet’s various systems to change?  This is a question of where warming will occur and how it will impact ecosystems, agriculture, oceans, or specific weather patterns.
  • Can we get to climate prediction that balances appropriate scale against societal relevance?  This is an important question because most of the common climate change reports show results that are of fairly course resolution. That is to say, when you look at your home, community or even state on a climate change map, it is usually just a tiny dot on a big spot on the map that is different in 20, 50 or 100 years time.  Getting the spots–or more accurately, the grids–to be smaller is important for answering questions about local temperature, rainfall and other predicted changes. These grids have to be big enough, however, to encompass change information.

Answering these questions is done by modeling the climate system (solar energy inputs, clouds, heat-trapping gases, ocean absorption, vegetation, snow and ice, etc.) against the historical records–some really old such as ice core or tree ring data or more modern like weather records since 1870–and current trends in, for example, volcanic eruptions and greenhouse gas emissions. Until recently, most of that was done by enormous–“super”–computers that could make the millions–and billions–of different computations happen quickly and repeatedly. Continue reading

La Niña conditions bode well for PNW salmonids.

It could be a good winter for salmon, trout and steelhead fisheries according to a report on the Columbia Basin Bulletin. As we shift from warmer, drier El Niño-driven weather to its cooler, wetter twin, La Niña, the chances of above-average precipitation and below-average temps increases. More snowpack and cooler winters means more water in streams over the entire water year (October to October).

At the same time, cooler ocean conditions off the coast favor plankton blooms that feed young fish entering the sea for the first time this summer and coming spring. While these conditions are not the direct consequence of La Niña, they do pair well with the conditions we’re likely to see this winter.

According to the Bulletin:

“An already chilled northeast Pacific Ocean and rapidly cooling equatorial sea surface temperatures likely bode well for Columbia River basin salmonids that start and end their lives in freshwater but spend most of their lives at sea.

The late winter and early spring saw a fading of “El Nino” conditions — elevated sea surface temperatures in the central and eastern equatorial Pacific — that had prevailed over the fall and winter.

El Nino conditions can affect climatic conditions worldwide as well as ocean conditions outside the equatorial zone. El Nino’s presence tilts the odds toward warmer and drier conditions in the Pacific Northwest during the fall and winter.

The reverse is true when La Nina conditions reign. And they do now reign, according to meteorologists.

“During July 2010 La Nina conditions developed, as negative sea surface temperature anomalies strengthened across the central and eastern equatorial Pacific Ocean,” according to an ENSO (El Nino/Southern Oscillation) alert issued Aug. 5 by the National Weather Service’s Climate Predictions Center.

All indicators in the Pacific Ocean show that we are now in the early stages of a La Niña event. Computer models predict the central Pacific will continue to cool in coming months, indicating some further strengthening of the event is likely, according to the Aug. 4 ENSO Wrapup produced by the Australian government’s Bureau of Meteorology.”

The researchers sample the coastal waters off Newport at biweekly intervals during the ocean upwelling season in spring, summer, and fall. The Northwest Fisheries Science Center crew samples various physical ocean conditions, such as temperature and salinity, as well as biological conditions such as the productivity of the food web and availability of food for salmon.

“The ocean’s very cold. Typically that’s been very good for the food web,” said Nathan Mantua, an atmospheric research scientist at the University of Washington and co-director for the school’s Center for Science in the Earth System.

“Survival for chinook and coho tends to be very high when conditions are like this,” Mantua said.

He said that the cooled coastal ocean is probably not La Nina linked but more likely the result of winds and other atmospheric phenomenon. It does give the ocean that welcomes young Columbia River salmon outmigrants a head start. A cool northeast Pacific is, eventually, a consistent end product of El Nino. So an early start means those favorable conditions for a longer period.”

Committed to 1000 years of Climate Change

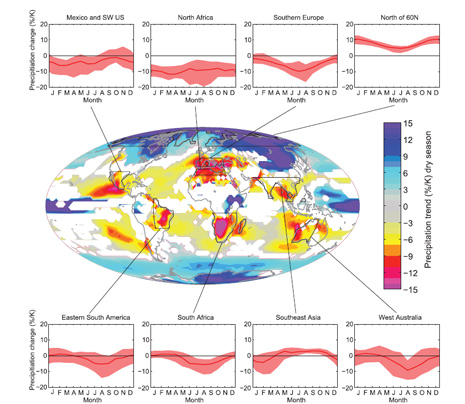
Range of change in precipitation in 8 regions. Graphic from PNAS, Solomon et al. 2009.

Range of change in precipitation in 8 regions. Graphic from PNAS, Solomon et al. 2009.

National Oceanic and Atmospheric Administration (NOAA) researchers have just published results that make the bold assertion that current carbon dioxide levels in the atmosphere will “lock us in” for 1000 years of consequences. The full press release is below.

More locally, note the severity of precipitation changes predicted for the Southwest U.S. and as the graphic above shows–some change in precipitation for the Pacific Northwest too.

A new scientific study led by the National Oceanic and Atmospheric Administration reaches a powerful conclusion about the climate change caused by future increases of carbon dioxide: to a large extent, there’s no going back.

The pioneering study, led by NOAA senior scientist Susan Solomon, shows how changes in surface temperature, rainfall, and sea level are largely irreversible for more than 1,000 years after carbon dioxide (CO2) emissions are completely stopped. The findings appear during the week of January 26 in the Proceedings of the National Academy of Sciences.

“Our study convinced us that current choices regarding carbon dioxide emissions will have legacies that will irreversibly change the planet,” said Solomon, who is based at NOAA’s Earth System Research Laboratory in Boulder, Colo. Continue reading

ENSO: a dry fall and winter?

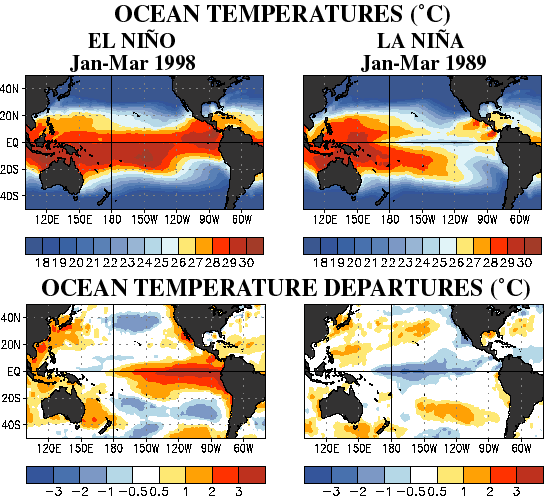
According to the latest from the National Oceanic and Atmospheric Administration Climate Prediction Center, a weak El Niño continued during September 2009, as sea surface temperature anomalies remained nearly unchanged across much of the equatorial Pacific Ocean. Sea surface temperatures are the most important indicators for changes in the El Niño-Southern Oscillation cycle (abbreviated as ENSO). ENSO can be defined as anomalous warming in the eastern Pacific ocean; a reversal of oceanic surface temperature changes where the eastern pacific is relatively warm and the western pacific is relative cool. Like an engine warming, this action impacts the air (and water vapor) above it, sending currents of warm moist air in particular directions.

Courtesy of NOAA.

Courtesy of NOAA.

Expected El Niño impacts during this fall and early winter include more precipitation over the central tropical Pacific Ocean and drier-than-average conditions over Indonesia. For the lower 48 United States, potential impacts include above-average precipitation along the Gulf Coast and below-average precipitation for the Pacific Northwest. The Midwest could be warmer and drier than normal while the Southwest may get some above-average precipitation this winter.

But remember, these are all just predictions based on long-term trends, not on day to day forecasts of weather. Some El Niño years have seen monstrous storms delivered to our region, but overall, the trend is towards drier conditions.

According to the National Drought Monitor, the Northwest quadrant of Oregon is already abnormally dry. So the news of a predicted drier than average fall and early winter is not good for farmers, water providers, well owners and fish managers. Our relatively dry, mild fall weather is in keeping with this prediction, but again, nothing is completely certain when you are working with averages in climate prediciton, except that over time, this phase of ENSO tends to be drier than normal. Even so, keep your boots handy and your emergency supplies stocked.

The upside of this prediction is that for parched California, Texas and the desert Southwest, things might look up if the storms deliver their hoped-for payloads this fall and winter months.

“And it never failed that during the dry years the people forgot about the rich years, and during the wet years they lost all memory of the dry years.  It was always that way.” –John Steinbeck, East of Eden, 1952

Ocean pH spells more trouble for oysters and oystermen

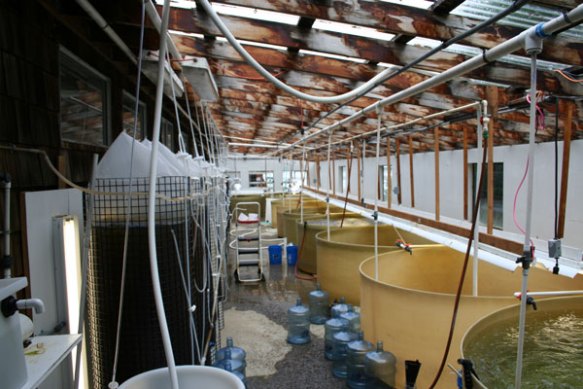
Many months ago, I posted on the topic of Vibrio tubiashii infesting local waters and jeopardizing the viability of Whiskey Creek Shellfish Hatchery in Netarts, OR.  Whiskey Creek supplies larvae for hundreds of West Coast oyster producers.  V. tubiashii is a little understood bacteria that thrives in deep waters, and seems to tolerate a lower pH. After nearly a year of work with Oregon State University and others, the hatchery installed ultraviolet lights and other sterilization procedures for its Netarts Bay intake water that successfully lowered the pathogen counts in their tanks.

Whiskey Creek Shellfish Hatchery, Netarts, Oregon. Photo by R. Emanuel

Whiskey Creek Shellfish Hatchery, Netarts, Oregon. Photo by R. Emanuel

When I visited the owners late this spring, a new situation had arisen: lowered pH in the water was also killing off or weakening the microscopic larvae. With lowered pH levels–and thus higher acidity, the young creatures cannot construct shells and successfully move into another stage as “seed” attached to a hard substrate (or surface).  After this second, serious setback, hatchery owner Sue Cudd was openly pessimistic about the future of the hatchery or the shellfish business, at least her’s in Oregon.

According to a June 14th article in the Seattle Times, Washington State shellfish growers seem to be experiencing similar problems related to ocean water pH.  The evidence points to increased carbon dioxide levels in sea water off the entire Pacific Northwest Coast.

As Craig Welch reports:

Now, as the oyster industry heads into the fifth summer of its most unnerving crisis in decades, scientists are pondering a disturbing theory. They suspect water that rises from deep in the Pacific Ocean — icy seawater that surges into Willapa Bay and gets pumped into seaside hatcheries — may be corrosive enough to kill baby oysters.

If true, that could mean shifts in ocean chemistry associated with carbon-dioxide emissions from fossil fuels may be impairing sea life faster and more dramatically than expected.

Recent work by researchers such as Zeebe et al. 2008 and Orr et al. 2005 indicate that atmospheric CO2 emissions are driving carbonic acid levels in sea water to historic highs (in human, not geologic terms). Carbonic acid is produced when gasseous carbon dioxide is dissolved in water. Though only midlly corrosive, carbonic acid reduces the most common and accessable dissolved form of calcium carbonate: aragonite.  Aragonite is the basic building block of shellfish shells.  The lack of aragonite, in turn, reduces the ability for shellfish to grow and produce new layers of calcium carbonate shell. In larvae, which in most organisms start out shelless, the acidic environment and lack of aragonite prevents any shell production, dooming the young to a short existence or a weakened state where they may be more vulnerable to predators.

At present, we’re at the stage of seeing anecdotal evidence that backs up modeling and lab-based research.  This is an important trend, however–one that we should keep our eyes on as it develops in the next few years.

How much carbon dioxide is in your atmosphere?

Latest data for atmospheric CO2

In 1859, an Irish scientist named John Tyndall built the world’s first ratio spectrophotometer and identified the natural “greenhouse effect” that makes life possible on planet Earth. This effect is enhanced to a hazard when excess carbon dioxide is put into the atmosphere. This is the basic premise behind climate change science, policy, and adaptation.

Almost century later (1958), Charles David Keeling put up an instrument to measure the amount of carbon dioxide in the atmosphere at the Mauna Loa National Observatory in Hawaii. The consequence of both of these scientists’ work is a host of studies of the climate and a new consensus that the status of climate change is a result of rising atmospheric greenhouse gas emissions since the Industrial Revolution. Monitoring the concentration of carbon dioxide in the atmosphere is probably the single most important job for climate science. Why? Because current climate science identifies climatic “thresholds” that tip the world’s climate from one status to another. Knowing how much CO2 is there now and how much has been tells us when changes might occur.

A website called CO2Now was started to pull that data out of the scientific literature and put it in a handy format for the public to view. They’ve even developed some nifty “widgets” to allow for websites to track and publish that data month to month. I’ve posted one here, above. I have also added one of the site’s smaller widgets to the right side of this blog.

Are We Heading for Drought this Water Year?

The North Coast and Willamette Valley have been unusually dry this water year (October 1-October 1). In fact, much of Oregon appears to be poised to experience drought in the coming months, especially if precipitation in the higher elevations continues to fall as rain or if snows melt quickly once they accumulate.

According to the Natural Resource Conservation Service, Oregon Coastal Division is about 18″ below normal, recording from March of last year. We’re about 13″ below normal since the start of the water year. In terms of our average precipitation, the N. Coastal basin is now 62% below normal. In fact, the Northern Coast Range is one of the driest regions of the state in terms of its deviation from average.

A graphic map of snow and precipitation totals in Oregon’s basins can be found by going here. The U.S. Drought Monitor reports that the coast is in an “abnormally dry” period (yellow on the map). Meanwhile, the Willamette Valley appears to be in moderate drought conditions (brown).

So, what does this mean for residents, businesses, and farms? Water conservation may very well be in the cards for the late spring through summer months. While the practice is a good one for most years, this year may indeed continue to be a dry one, even with spring storms that dose us through May or June. It would take a lot of snow and rain to make up for the close to 40% deficit in the Coast Range. Residents of the Willamette Valley too should be getting ready to let those lawns dry and cars get a little dirtier than normal, as conservation measures may be critical for the coming year.

Climate Change Models Available on Google Earth

This post comes courtesy of Jack Thigpen, Extension Director of North Carolina Sea Grant. Those of you who use Google Earth for desk-top exploring or even mapping the world will find the following very interesting. Even if you don’t use Google Earth (and you don’t even have to know what Google Earth is), the website mentioned below contains movies in Quicktime and Windows Media that illustrate the concepts and issues. Those concepts and issues are: global surface temperatures, solar radiation potential, global oil consumption, carbon emissions.  This is useful stuff for climate watching-,  Google Earth-using folks like me!  One special note: the temperatures come in two flavors: NCAR and GISS ModelE. Of the two, the NCAR model is finer resolution–meaning you can look at North America and see smaller areas of temperature change over time, though microclimates will show even more variation over time.  Also of note: readers may or may not agree with the Climate Change Project (both a product and part-producer of Al Gore’s successful “An Inconvenient Truth” movie), but the science used in at least the temperature graphics is supported by years of serious research by reputable institutions and scientists.

I want to bring to your attention a new resource for use in your presentations. TCP received funding from Google.org to hire interns to create maps specifically to help us communicate about climate change. This project was completed last semester, and I’m happy to share the results with you.

You can download maps in Google Earth (a free program) or you can simply download the movies and incorporate them into your slideshow as you see fit. Content includes maps showing surface temperature predictions through 2100, solar energy potential for the U.S., global and U.S. carbon emissions, and global oil consumption.

Please visit:
http://sites.google.com/a/theclimateproject.org/google-earth-internship/

2008 Water Year in Review

As the year draws to a close here on the North Coast, a frigid air mass to our east is locked in losing battle with the marine layer for supremacy.  With the exception of Astoria, most of the communities along the coast have been spared snow since the weekend. While more is predicted for this week, it looks as though the arctic air will soon move to east and allow our communities to travel and communicate with those on the other side of the Coast Range.

So far, our new water year (October 2008 to October 2009) started out mild and relatively dry. While cold, December precipitation has now topped only 7 inches, still nearly half of the average for the month. Year to date, we have only received 65 inches vs. our normal 90 inches.  Since November has been only one major flood event on North Coast streams and that event paled in comparison to 1996, 2006 and 2007 floods.  According to the National Climate Prediction Center, ocean and atmospheric conditions on the west coast of North America have a 50% probability of being affected by mild La Niña status, meaning a tendency to be cooler and wetter than normal. So far, the former is partly true but we have yet to see the wetter conditions that sometimes come with a mild La Niña.

While the 2007-2008 water year saw significant flooding events–including the Great Coastal Gale of 2007–precipitation totals are still at least 16 inches below normal.  Compared to this time last year, the North Coast is relatively dry and mild.

H2ONC will take a holiday break until the new calendar year. I hope that everyone reading this will have a happy, safe, and restful time spent with family and friends.

EPA Issues Report on Climate Change & Water

On Oct 2 the US Environmenal Protection Agency eleased  a strategy that outlines national actions to manage programs and invest resources to reduce adverse effects on water from climate change .  The full draft document can be found at: http://www.epa.gov/water/climatechange/.

The document’s executive summary outlines the following areas of concern with regards to water resources planning and management:

1. Increases in Water Pollution Problems: Warmer air temperatures will result in warmer water. Warmer waters will:
• hold less dissolved oxygen making instances of low oxygen levels and “hypoxia” (i.e., when dissolved oxygen declines to the point where aquatic species can no longer survive) more likely; and

• foster harmful algal blooms and change the toxicity of some pollutants.
The number of waters recognized as “impaired” is likely to increase, even if pollution
levels are stable.

2. More Extreme Water-Related Events: Heavier precipitation in tropical and inland storms will increase the risks of flooding, expand floodplains, increase the variability of streamflows (i.e., higher high flows and lower low flows), increase the velocity of water during high flow periods and increase erosion. These changes will have adverse effects on water quality and aquatic system health. For example, increases in intense rainfall result in more nutrients, pathogens, and toxins being washed into waterbodies.

3. Changes to the Availability of Drinking Water Supplies: In some parts of the country, droughts, changing patterns of precipitation and snowmelt, and increased water loss due to evaporation as a result of warmer air temperatures will result in changes to the availability of water for drinking and for use for agriculture and
industry. In other areas, sea level rise and salt water intrusion will have the same effect. Warmer air temperatures may also result in increased demands on community water supplies and the water needs for agriculture, industry, and energy production are likely to increase.

4. Waterbody Boundary Movement and Displacement: Rising sea levels will move ocean and estuarine shorelines by inundating lowlands, displacing wetlands, and altering the tidal range in rivers and bays. Changing water flow to lakes and streams, increased evaporation, and changed precipitation in some areas, will affect the size of wetlands and lakes. Water levels in the Great Lakes are expected to fall.

5. Changing Aquatic Biology: As waters become warmer, the aquatic life they now support will be replaced by other species better adapted to the warmer water (i.e., cold water fish will be replaced by warm water fish). This process, however, will occur at an uneven pace disrupting aquatic system health and allowing non-indigenous and/or invasive species to become established. In the long-term (i.e., 50 years), warmer water and changing flows may result in significant deterioration of aquatic ecosystem health in some areas.

6. Collective Impacts on Coastal Areas: Most areas of the United States will see several of the water-related effects of climate change, but coastal areas are likely to see multiple impacts of climate change. These impacts include sea level rise, increased damage from floods and storms, changes in drinking water supplies, and increasing temperature and acidification of the oceans.

These overlapping impacts of climate change make protecting water resources in coastal areas especially challenging.